The OSINT Dashboard Boom: Three Products, Three Weeks, One Signal
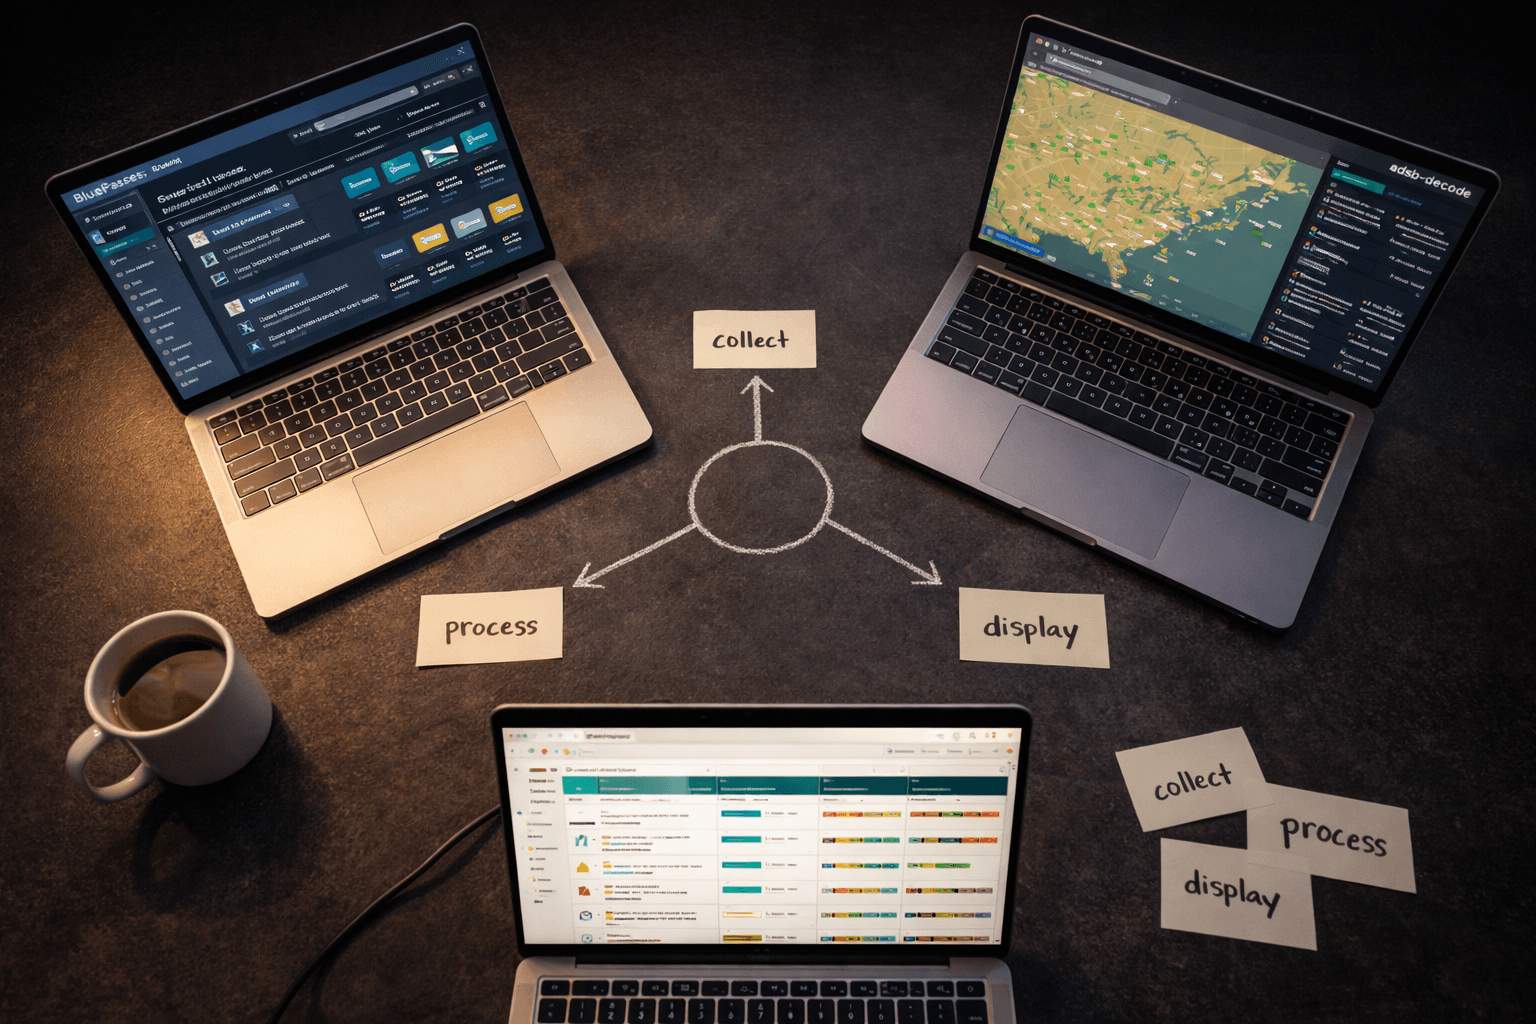
We built three separate intelligence dashboards in three weeks and realized they all follow the same pattern: collect public data, process it through automated pipelines, present it through purpose-built interfaces. That pattern is everywhere.
We didn't plan to build three dashboards in three weeks. It just happened that way.
First we built BluePages -- a tool that crawls business websites and scores them on 13 AI readiness signals. Then we built adsb-decode -- a live aircraft tracker that decodes raw radio signals into planes on a map. Then we built Mission Control -- an internal operations dashboard that reads from our research system and shows project status, content pipelines, and strategic priorities at a glance.
Three products. Three completely different purposes. But when we stepped back and looked at what we'd actually built, they were all the same thing.
The Pattern
Every one of these products follows the same three-step process:
- Collect publicly available data. Business websites, radio signals from aircraft transponders, research links and articles.
- Process it through an automated pipeline. Crawlers, decoders, analysis engines -- software that turns raw data into structured information.
- Present it through a purpose-built interface. Not a spreadsheet. Not a PDF report. A live dashboard where the information updates itself and you can interact with it.
That's it. Collect, process, present. Three steps. The data sources change. The processing logic changes. The interface changes. But the architecture is identical every time.
There's a name for this pattern. It's called OSINT -- open-source intelligence. And it's been around for decades.
What OSINT Actually Means
OSINT sounds like a government acronym because it is one. Intelligence agencies coined the term to describe intelligence gathered from publicly available sources -- newspapers, radio broadcasts, public records, academic papers. Anything you don't need a security clearance to access.
In plain terms: gathering information that's already out there and making it useful.
That's different from scraping private data or hacking into systems. OSINT is about public information. The kind anyone could find if they had enough time, knew where to look, and had a way to organize what they found. The trick was always the organizing part.
Until recently, that part was expensive. You needed analysts. You needed custom software. You needed time.
Three things changed.
Why This Pattern Is Exploding Now
Data became abundant. Every business has a website. Every aircraft broadcasts its position. Every government agency publishes records online. Every job board, review site, permit office, and regulatory body puts information on the internet. Ten years ago, a lot of this data was locked in filing cabinets or behind proprietary systems. Now it's sitting on public servers waiting to be read.
AI made processing cheap. The middle step -- turning raw data into structured information -- used to require teams of people. A human had to read each business website and evaluate it. A human had to monitor each data source and flag what changed. Now an AI can process thousands of websites in hours. It can read, categorize, score, and summarize at a scale that wasn't possible three years ago. The per-unit cost of analysis dropped from dollars to fractions of a cent.
Web frameworks made presentation fast. Building a good-looking, interactive dashboard used to take months. Modern frameworks -- Next.js, React, Tailwind -- compress that to days. The live aircraft map on adsb-decode runs on a Leaflet.js map with real-time updates. BluePages renders 4,504 business score pages from a SQLite database. These aren't enterprise software projects. They're focused tools built fast because the tooling allows it.
When all three of these forces converge, you get an explosion of OSINT dashboards. Not just from us -- everywhere.
What We Actually Built
Here's a closer look at each product and what makes it tick.
BluePages: Scoring 4,504 Businesses
BluePages crawls business websites across 150 cities in Western North Carolina and scores them on 13 signals that affect how AI systems find and recommend them. Does the business have structured data? Email authentication? A mobile-responsive site? Fresh content?
The raw data is public -- every business website is readable by anyone with a browser. The processing pipeline is a Python crawler that checks each signal and rolls them into a score from 0 to 100. The interface is a Next.js site where you can look up any business and see exactly which signals they're hitting and which they're missing.
4,504 businesses scored. 150 cities mapped. The average score is about 40 out of 100. That gap between where businesses are and where they could be is the entire value proposition.

adsb-decode: Live Aircraft Tracking
adsb-decode turns raw 1090 MHz radio signals into live aircraft positions on a map. Every commercial aircraft broadcasts its GPS coordinates, altitude, speed, and callsign. A $30 antenna picks up the signal. Our decoder -- written from scratch in Rust -- processes the raw bits into structured data.
The raw data is literally floating through the air. Aircraft transponders broadcast to anyone listening. The processing pipeline handles demodulation, error correction, position decoding, and track assembly. The interface is a real-time map where you can watch planes move, click on them for details, and see flight trails.
298 tests. Four build targets. Open source. The signal processing was the hard part -- the rest was plumbing.
Mission Control: Internal Operations Dashboard
This one isn't public, but it follows the same pattern. Mission Control reads from our intelligence-hub -- a knowledge system where we process research links, track projects, manage content pipelines, and monitor strategic signals.
The raw data is our own research output -- 209 links processed, 16 key signals, 25 projects across six tiers, 300 implementation ideas. The processing pipeline parses markdown files and extracts structured information. The interface is a dashboard showing project health, content status, research activity, and priority recommendations.
It's an OSINT dashboard pointed at our own operations. The data is semi-public -- research links and industry analysis -- processed into a command center.
The Intelligence-Hub Itself
There's actually a fourth product hiding in plain sight. The intelligence-hub that feeds Mission Control is itself an OSINT system. It collects publicly available information -- tweets, articles, GitHub repos, newsletters -- processes it through an analysis pipeline, and outputs structured intelligence. 209 links distilled into 16 actionable signals.
Same pattern. Collect, process, present.
What This Means for Businesses
Here's the part that matters if you're not a software developer.
Every industry has public data that nobody is organizing. The information is out there. It's free. And nobody in your market is doing anything useful with it.
Think about what's publicly available in your industry:
- Competitor pricing. Most businesses publish their prices on their website. Nobody is tracking how those prices change over time.
- Online reviews. Every business has Google reviews, Yelp reviews, Facebook reviews. Nobody is aggregating them across competitors to spot trends -- which complaints keep coming up, which praise keeps repeating, where the gaps are.
- Permits and licenses. County offices publish building permits, business licenses, health inspections, zoning changes. That data tells you who's opening, who's expanding, and where the growth is happening -- months before anyone else notices.
- Job postings. When your competitors post job listings, they're telling you exactly what they're investing in. Five new sales reps means they're expanding. A data analyst means they're getting serious about metrics. A CTO search means leadership is changing.
- Public records. Property transfers, court filings, incorporation records, regulatory filings. All public. All sitting in databases that nobody in your industry is watching systematically.
Each one of these could be an OSINT dashboard. Collect the data automatically. Process it into something structured. Present it through an interface that makes the patterns visible.
Practical Examples Any Business Could Build
A real estate agency could track every new building permit in their market area. When a permit gets filed, the dashboard flags it -- new construction means future listings. Track permit volume by neighborhood and you can see where development is heading before the "Coming Soon" signs go up.
A restaurant owner could aggregate reviews across every competitor in their area. Not just star ratings -- the actual text. What are people complaining about? What do they love? If three restaurants in your area are getting dinged for slow service and you're not, that's a marketing angle. If everyone is praising a specific type of cuisine and nobody in your area offers it, that's an opportunity.
A contractor could monitor municipal bid postings across every county they serve. Government contracts are public. Most contractors check one or two sites manually. A dashboard that aggregates every relevant posting across 10 counties, filtered by trade and budget range, would surface opportunities that manual checking misses.
A recruiter could watch company job boards across their entire territory. When a company you've never worked with suddenly posts 15 positions in a month, that's a warm lead. The data is public. Nobody is watching it systematically.
A property manager could track code enforcement actions, health department inspections, and zoning changes across their portfolio area. All public records. All available online. Nobody is connecting the dots between a zoning change three blocks away and what it means for property values on your street.
The Honest Part
Building these dashboards still requires technical skill. We're not going to pretend otherwise.
Writing a crawler that reliably scrapes business websites is real software engineering. Decoding ADS-B radio signals from scratch is hard. Building a responsive dashboard that handles thousands of records without choking takes experience.
The tools are getting easier. AI can write a lot of the code now. No-code platforms handle simple cases. But anything that involves messy real-world data -- websites that don't follow standards, radio signals with errors, public records in inconsistent formats -- still needs someone who knows what they're doing.
The gap isn't in the idea. Anyone can see that their industry has public data worth organizing. The gap is in execution. Turning "we should track competitor pricing" into a live dashboard that actually works, stays current, and handles edge cases -- that's where the work is.
That gap is closing. Fast. But it's not closed yet.
The Signal
Here's what we took away from building three of these in three weeks.
OSINT dashboards are the new small business intelligence layer. Not because the concept is new -- intelligence agencies have done this for decades. But because the cost just dropped through the floor. The data is abundant. The processing is cheap. The presentation is fast.
Every industry has public information that nobody is organizing into anything useful. The first business in any market that builds a dashboard around their industry's public data gets an information advantage that compounds over time. Week one, it's interesting. Month six, you're seeing patterns nobody else can see. Year two, you're making decisions based on data your competitors don't know exists.
We're going to keep building these. The pattern works too well to stop.
If your business is sitting on a pile of public data and no way to make sense of it, that's exactly what we do.
Blue Octopus Technology builds custom software, integrates AI, and automates workflows for businesses ready to grow. Based in Franklin, NC -- serving clients nationwide.
Stay Connected
Get practical insights on using AI and automation to grow your business. No fluff.